 [/metrics] — seriesAggregateFunc生命周期
# 一、聚合函数定义
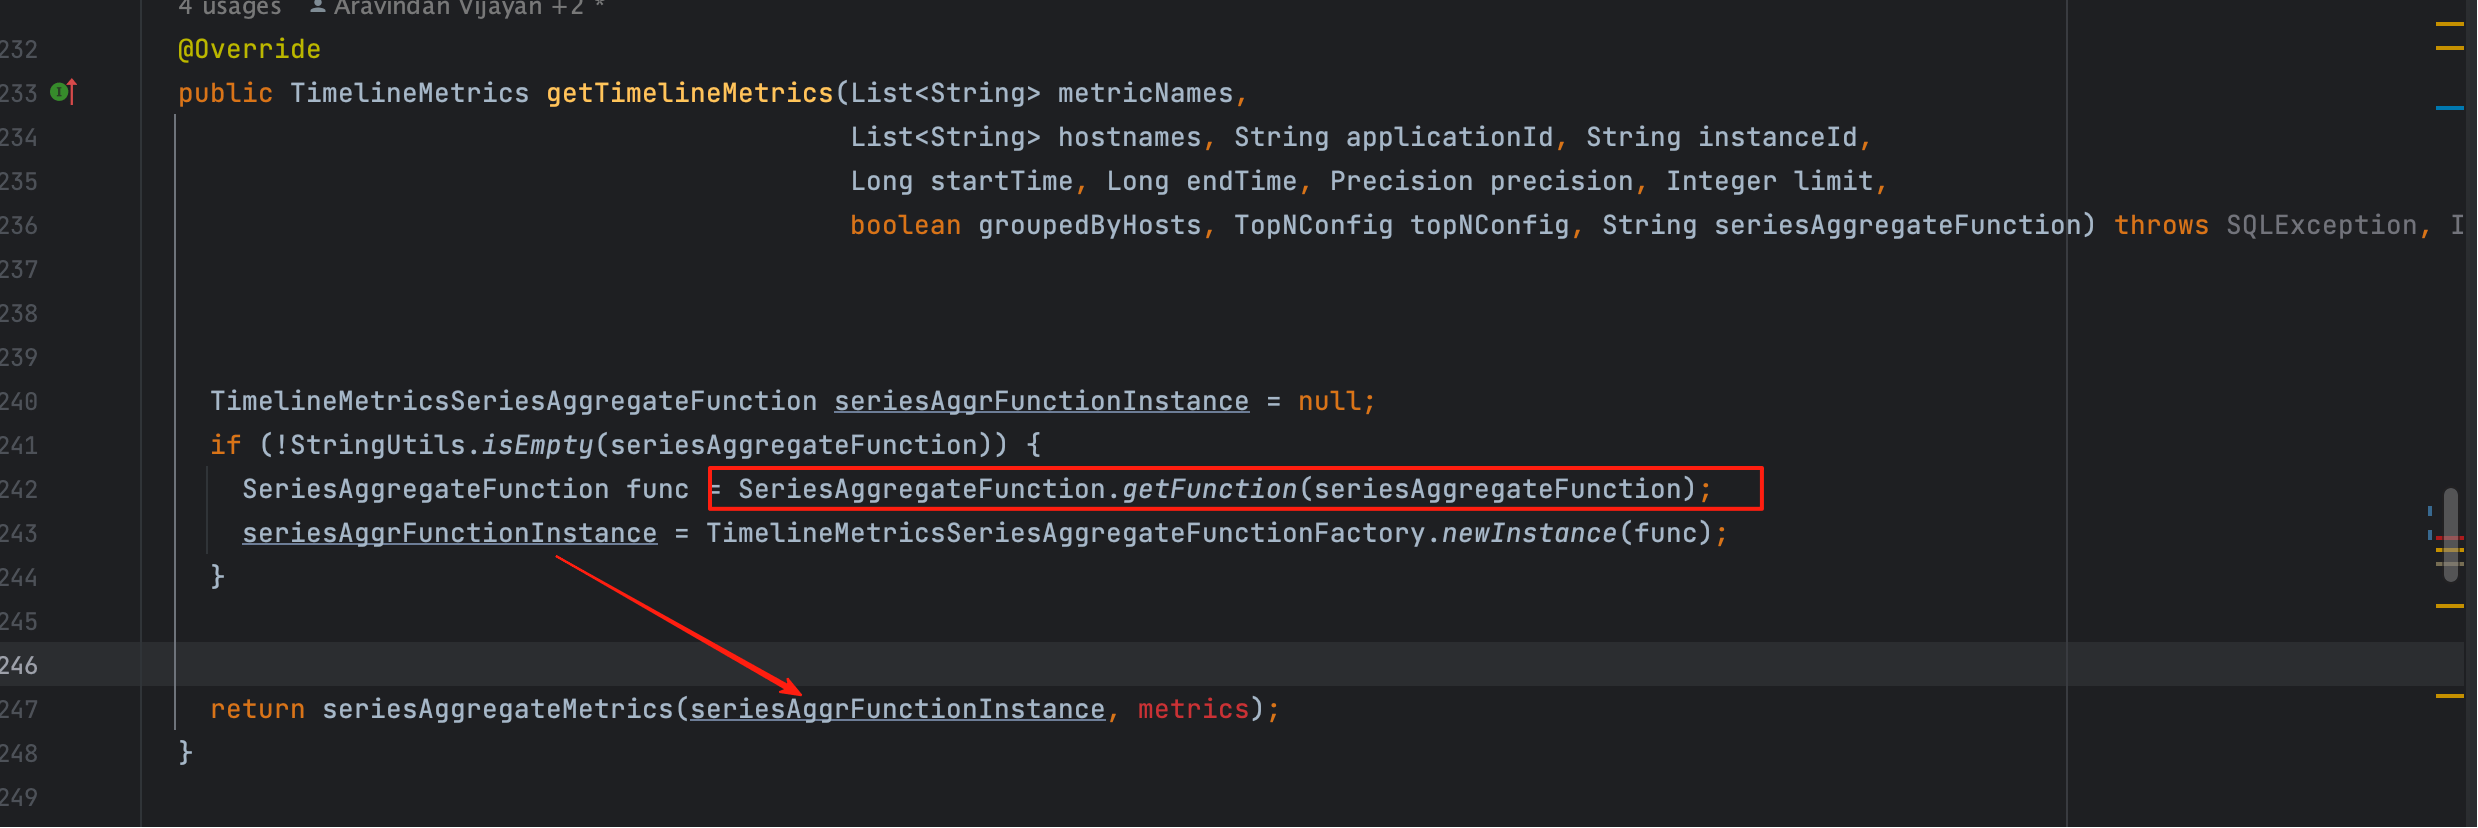
在 Ambari-Metrics 的 /metrics 查询中,如果传入了 seriesAggregateFunction 参数,最终会走到下面的代码逻辑。
聚合函数的定义非常明确,只有四种:
public enum SeriesAggregateFunction {
  AVG, MIN, MAX, SUM;

  public static boolean isPresent(String functionName) {
    try {
      SeriesAggregateFunction.valueOf(functionName.toUpperCase());
    } catch (IllegalArgumentException e) {
      return false;
    }
    return true;
  }

  public static SeriesAggregateFunction getFunction(String functionName) throws Function.FunctionFormatException {
    try {
      return SeriesAggregateFunction.valueOf(functionName.toUpperCase());
    } catch (NullPointerException | IllegalArgumentException e) {
      throw new Function.FunctionFormatException(
            "Function should be sum, avg, min, max. Got " + functionName, e);
    }
  }
}
2
3
4
5
6
7
8
9
10
11
12
13
14
15
16
17
18
19
20
21
注意
这意味着用户只能选择 sum、avg、min、max 四种聚合方式。
如果传入其他字符串,比如 count,就会抛出异常。
# 二、应用逻辑:聚合函数实例化
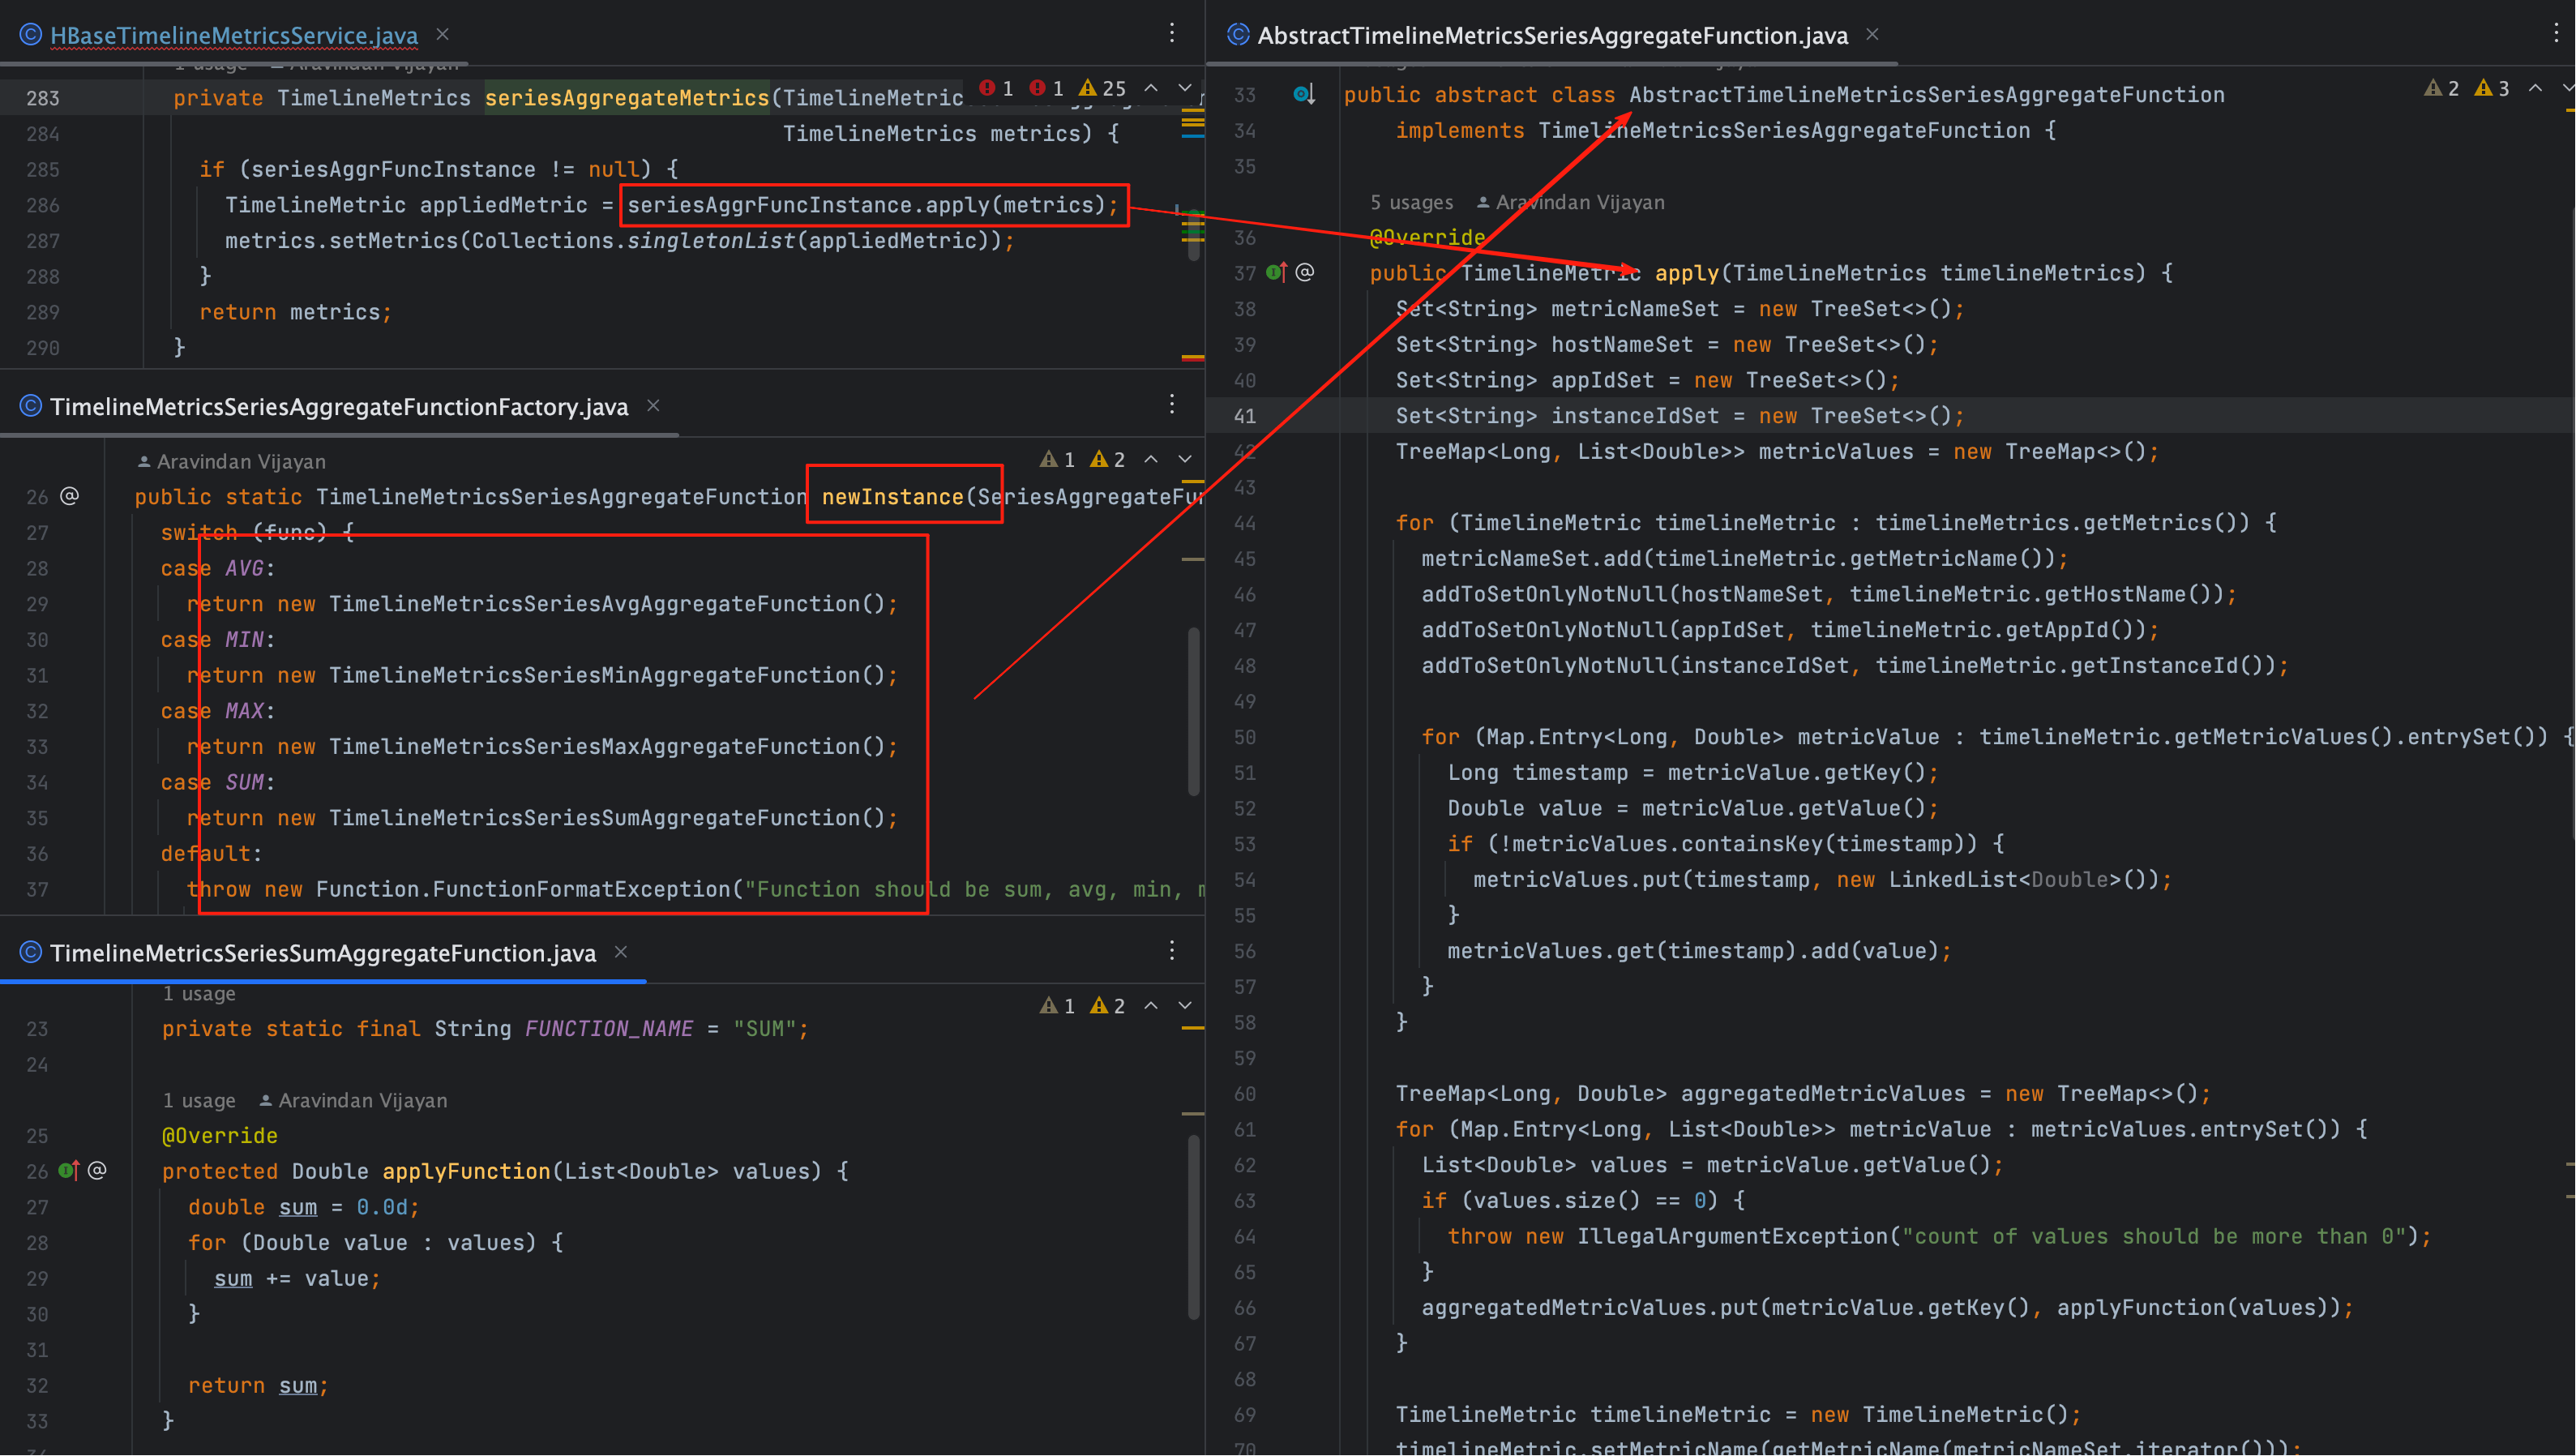
获取到函数类型之后,会由工厂类 TimelineMetricsSeriesAggregateFunctionFactory 选择对应的实现类。
调用链路如下图所示:
具体代码:
package org.apache.ambari.metrics.core.timeline.function;

import org.apache.ambari.metrics.core.timeline.aggregators.Function;

public class TimelineMetricsSeriesAggregateFunctionFactory {
  private TimelineMetricsSeriesAggregateFunctionFactory() {
  }

  public static TimelineMetricsSeriesAggregateFunction newInstance(SeriesAggregateFunction func) {
    switch (func) {
    case AVG:
      return new TimelineMetricsSeriesAvgAggregateFunction();
    case MIN:
      return new TimelineMetricsSeriesMinAggregateFunction();
    case MAX:
      return new TimelineMetricsSeriesMaxAggregateFunction();
    case SUM:
      return new TimelineMetricsSeriesSumAggregateFunction();
    default:
      throw new Function.FunctionFormatException("Function should be sum, avg, min, max. Got " +
          func.name());
    }
  }
}
2
3
4
5
6
7
8
9
10
11
12
13
14
15
16
17
18
19
20
21
22
23
24
25
这里的 seriesAggrFuncInstance 是如下几种之一:
TimelineMetricsSeriesAvgAggregateFunctionTimelineMetricsSeriesMinAggregateFunctionTimelineMetricsSeriesMaxAggregateFunctionTimelineMetricsSeriesSumAggregateFunction
提示
它们都继承自抽象类 AbstractTimelineMetricsSeriesAggregateFunction,并通过实现 applyFunction(values) 来定义各自的计算方式。
# 三、抽象类 apply 逻辑
抽象类统一了数据处理流程,不同函数只是计算方式不同。核心代码如下:
@Override
public TimelineMetric apply(TimelineMetrics timelineMetrics) {
  Set<String> metricNameSet = new TreeSet<>();
  Set<String> hostNameSet = new TreeSet<>();
  Set<String> appIdSet = new TreeSet<>();
  Set<String> instanceIdSet = new TreeSet<>();
  TreeMap<Long, List<Double>> metricValues = new TreeMap<>();

  // Step1: 遍历所有输入的 Metric
  for (TimelineMetric timelineMetric : timelineMetrics.getMetrics()) {
    metricNameSet.add(timelineMetric.getMetricName());
    addToSetOnlyNotNull(hostNameSet, timelineMetric.getHostName());
    addToSetOnlyNotNull(appIdSet, timelineMetric.getAppId());
    addToSetOnlyNotNull(instanceIdSet, timelineMetric.getInstanceId());

    // Step2: 按 timestamp 聚合所有的数值
    for (Map.Entry<Long, Double> metricValue : timelineMetric.getMetricValues().entrySet()) {
      Long timestamp = metricValue.getKey();
      Double value = metricValue.getValue();
      if (!metricValues.containsKey(timestamp)) {
        metricValues.put(timestamp, new LinkedList<Double>());
      }
      metricValues.get(timestamp).add(value);
    }
  }

  // Step3: 对同一时间戳的多值应用聚合函数
  TreeMap<Long, Double> aggregatedMetricValues = new TreeMap<>();
  for (Map.Entry<Long, List<Double>> metricValue : metricValues.entrySet()) {
    List<Double> values = metricValue.getValue();
    if (values.size() == 0) {
      throw new IllegalArgumentException("count of values should be more than 0");
    }
    aggregatedMetricValues.put(metricValue.getKey(), applyFunction(values));
  }

  // Step4: 组装成新的 TimelineMetric
  TimelineMetric timelineMetric = new TimelineMetric();
  timelineMetric.setMetricName(getMetricName(metricNameSet.iterator()));
  timelineMetric.setHostName(joinStringsWithComma(hostNameSet.iterator()));
  timelineMetric.setAppId(joinStringsWithComma(appIdSet.iterator()));
  timelineMetric.setInstanceId(joinStringsWithComma(instanceIdSet.iterator()));
  if (aggregatedMetricValues.size() > 0) {
    timelineMetric.setStartTime(aggregatedMetricValues.firstKey());
  }
  timelineMetric.setMetricValues(aggregatedMetricValues);
  return timelineMetric;
}
2
3
4
5
6
7
8
9
10
11
12
13
14
15
16
17
18
19
20
21
22
23
24
25
26
27
28
29
30
31
32
33
34
35
36
37
38
39
40
41
42
43
44
45
46
47
48
笔记
从这里我们可以看到,聚合逻辑完全是先收集 → 后计算 → 再组装的模式,保证了框架的可扩展性。
未来若要新增聚合函数,只需要扩展 applyFunction 即可。
# 四、运行示例猜想
为了便于理解聚合函数的执行效果,我们先构造一个简单场景:
假设查询的是 CPU 使用率,同时输入了两个主机的数据:
metricName: cpu_usage
host: host1
values: { 1000: 40.0, 2000: 60.0 }

metricName: cpu_usage
host: host2
values: { 1000: 20.0, 2000: 80.0 }
2
3
4
5
6
7
# Step1: 合并同一时间戳的值
1000 → [40.0, 20.0]
2000 → [60.0, 80.0]
2
# Step2: 应用 AVG 聚合函数
1000 → avg(40.0, 20.0) = 30.0
2000 → avg(60.0, 80.0) = 70.0
2
# Step3: 生成新 TimelineMetric
{
  "metricName": "cpu_usage",
  "hostName": "host1,host2",
  "metricValues": {
    "1000": 30.0,
    "2000": 70.0
  }
}
2
3
4
5
6
7
8
# Step4: 替换不同聚合函数效果对比
- MAX →
1000 → 40.0, 2000 → 80.0 - MIN →
1000 → 20.0, 2000 → 60.0 - SUM →
1000 → 60.0, 2000 → 140.0
提示
由此可见,seriesAggregateFunction 会在同一时间戳维度上,将多主机的数值进行归并计算。
# 五、运行示例实践
上面是理论推演,接下来我们用 真实的 curl 请求来验证。
# 1. 不带聚合函数的请求
curl --location --request GET 'http://dev1:6188/ws/v1/timeline/metrics?metricNames=load_five1&appId=HOST&hostname=dev1,dev2&startTime=1757640600000&endTime=1757640900000' \
--header 'User-Agent: Apifox/1.0.0 (https://apifox.com)' \
--header 'Accept: */*' \
--header 'Host: dev1:6188' \
--header 'Connection: keep-alive'
2
3
4
5
我们来看下参数:
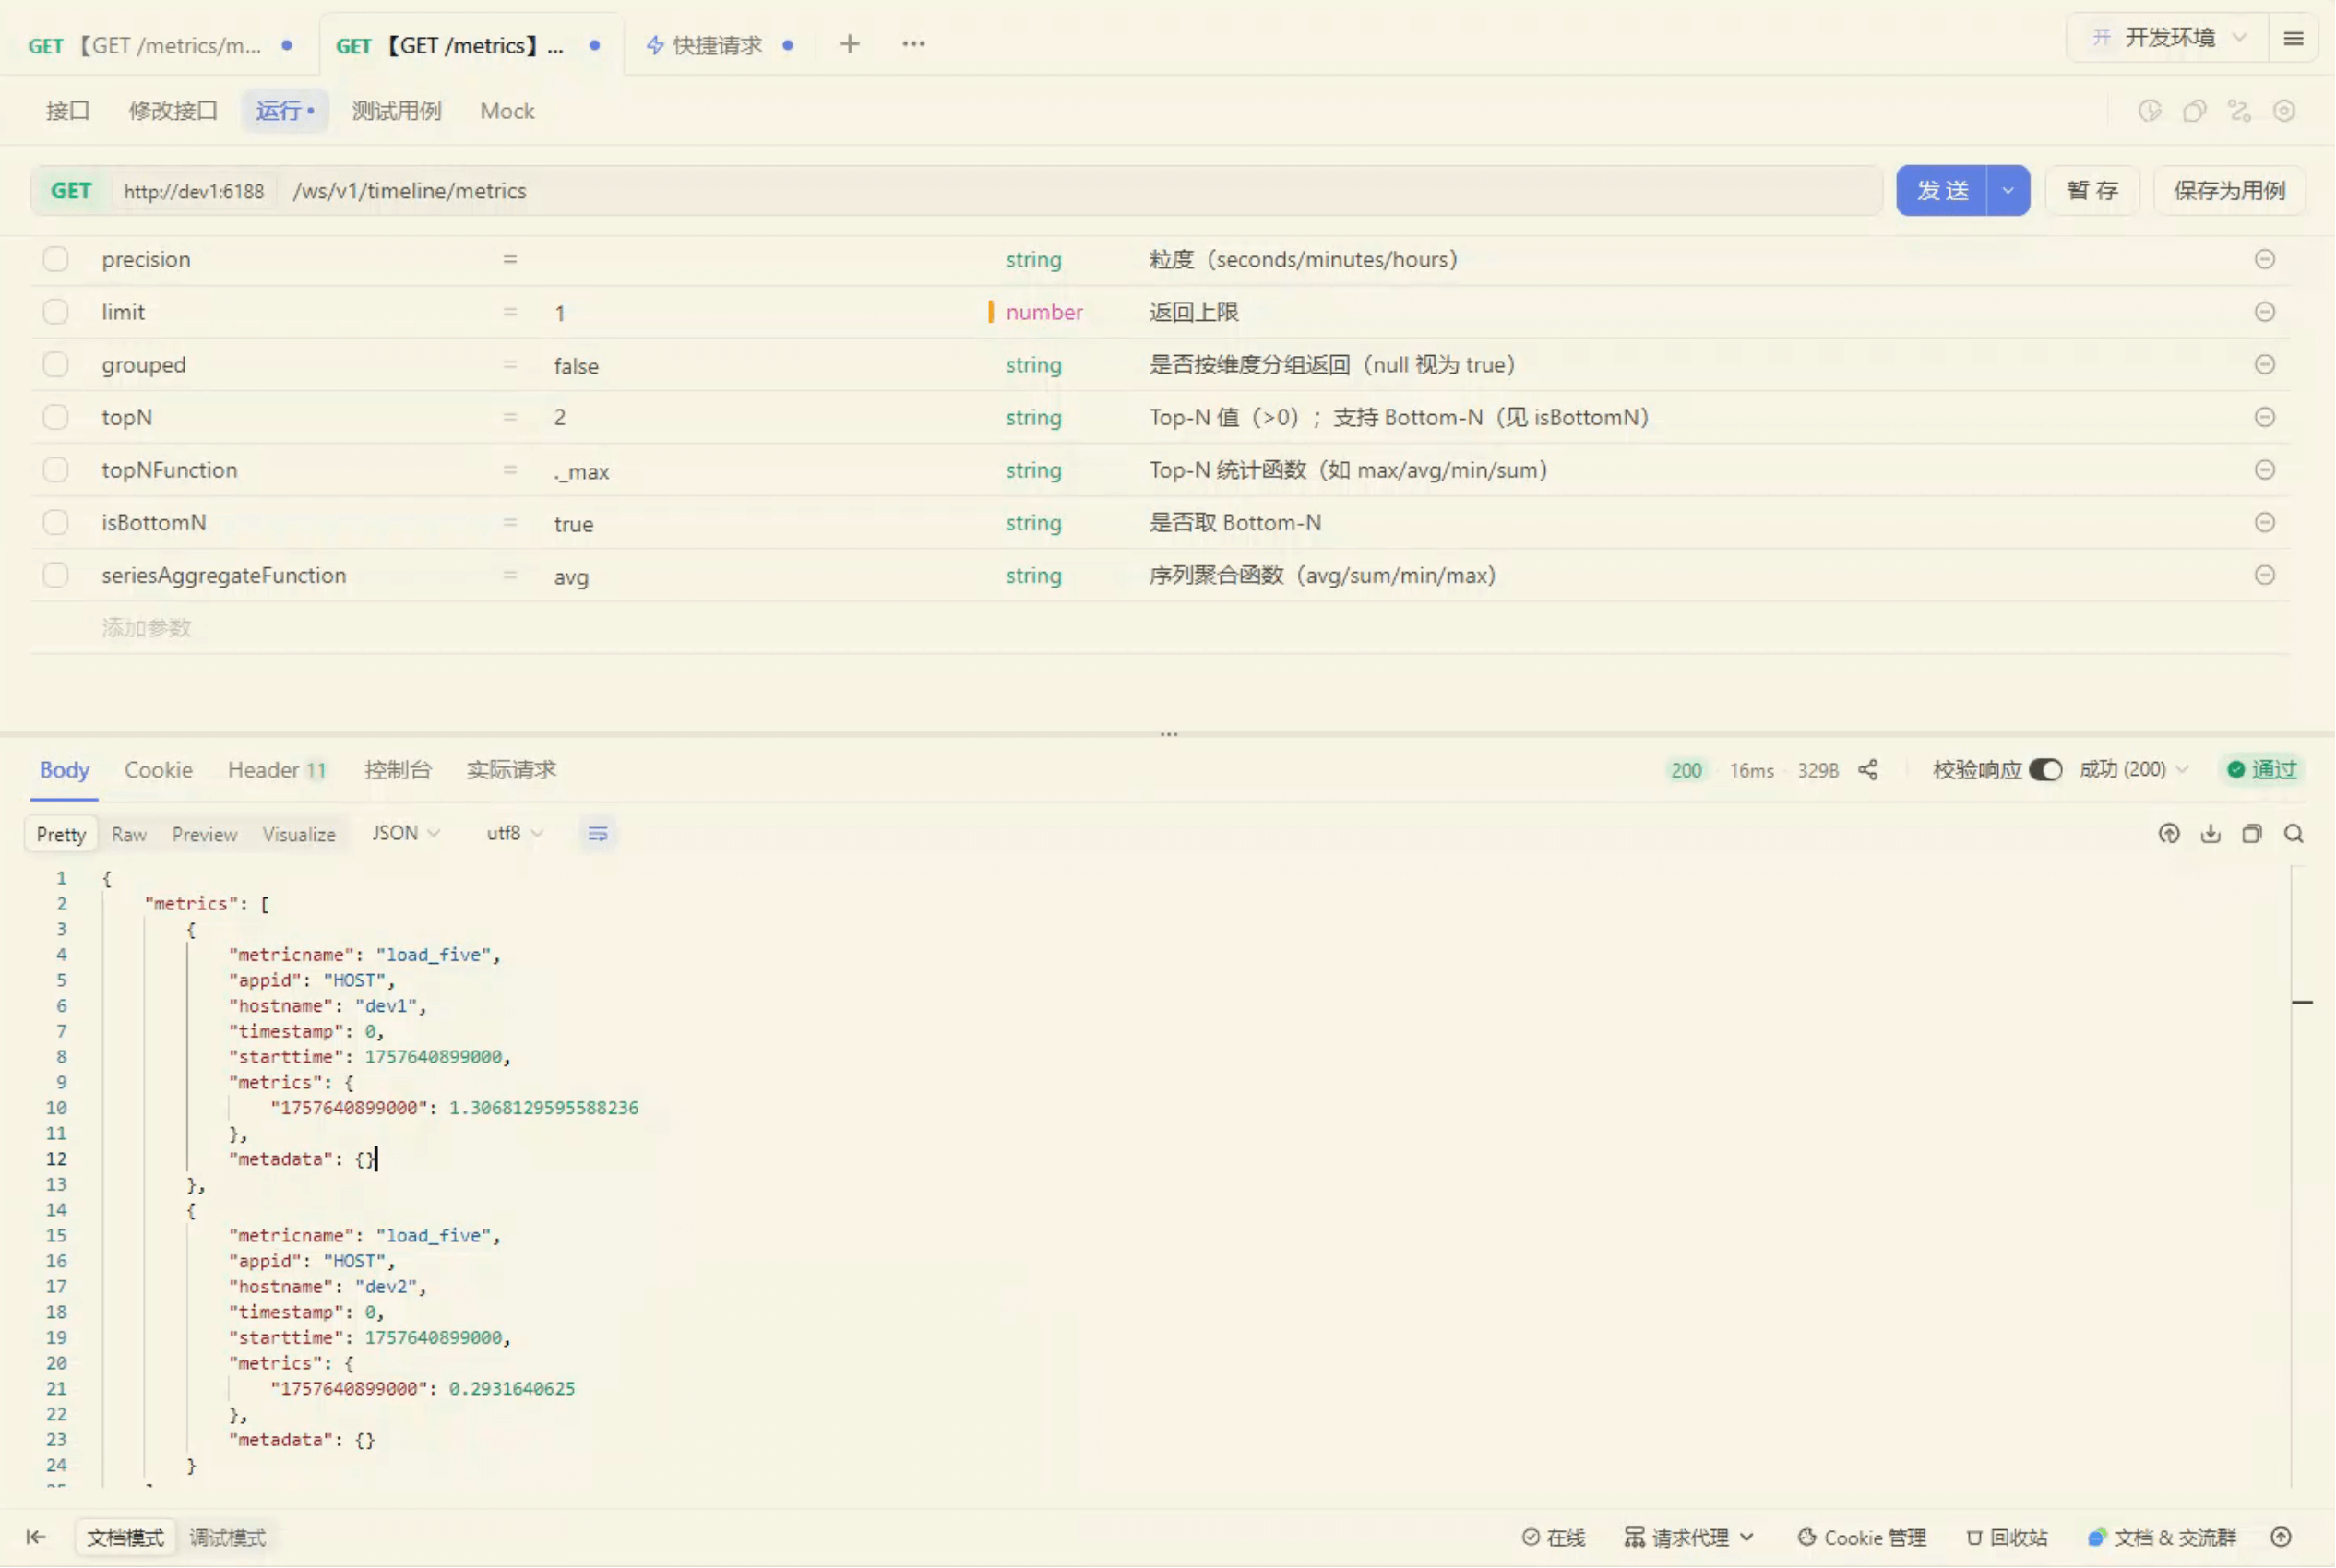
返回结果如下(每个主机单独返回一条数据):
{
  "metrics": [
    {
      "metricname": "load_five",
      "appid": "HOST",
      "hostname": "dev1",
      "timestamp": 0,
      "starttime": 1757640899000,
      "metrics": {
        "1757640899000": 1.3068129595588236
      },
      "metadata": {}
    },
    {
      "metricname": "load_five",
      "appid": "HOST",
      "hostname": "dev2",
      "timestamp": 0,
      "starttime": 1757640899000,
      "metrics": {
        "1757640899000": 0.2931640625
      },
      "metadata": {}
    }
  ]
}
2
3
4
5
6
7
8
9
10
11
12
13
14
15
16
17
18
19
20
21
22
23
24
25
26
这里 dev1 和 dev2 的数值分别展示,没有做聚合。
# 2. 带聚合函数的请求(AVG)
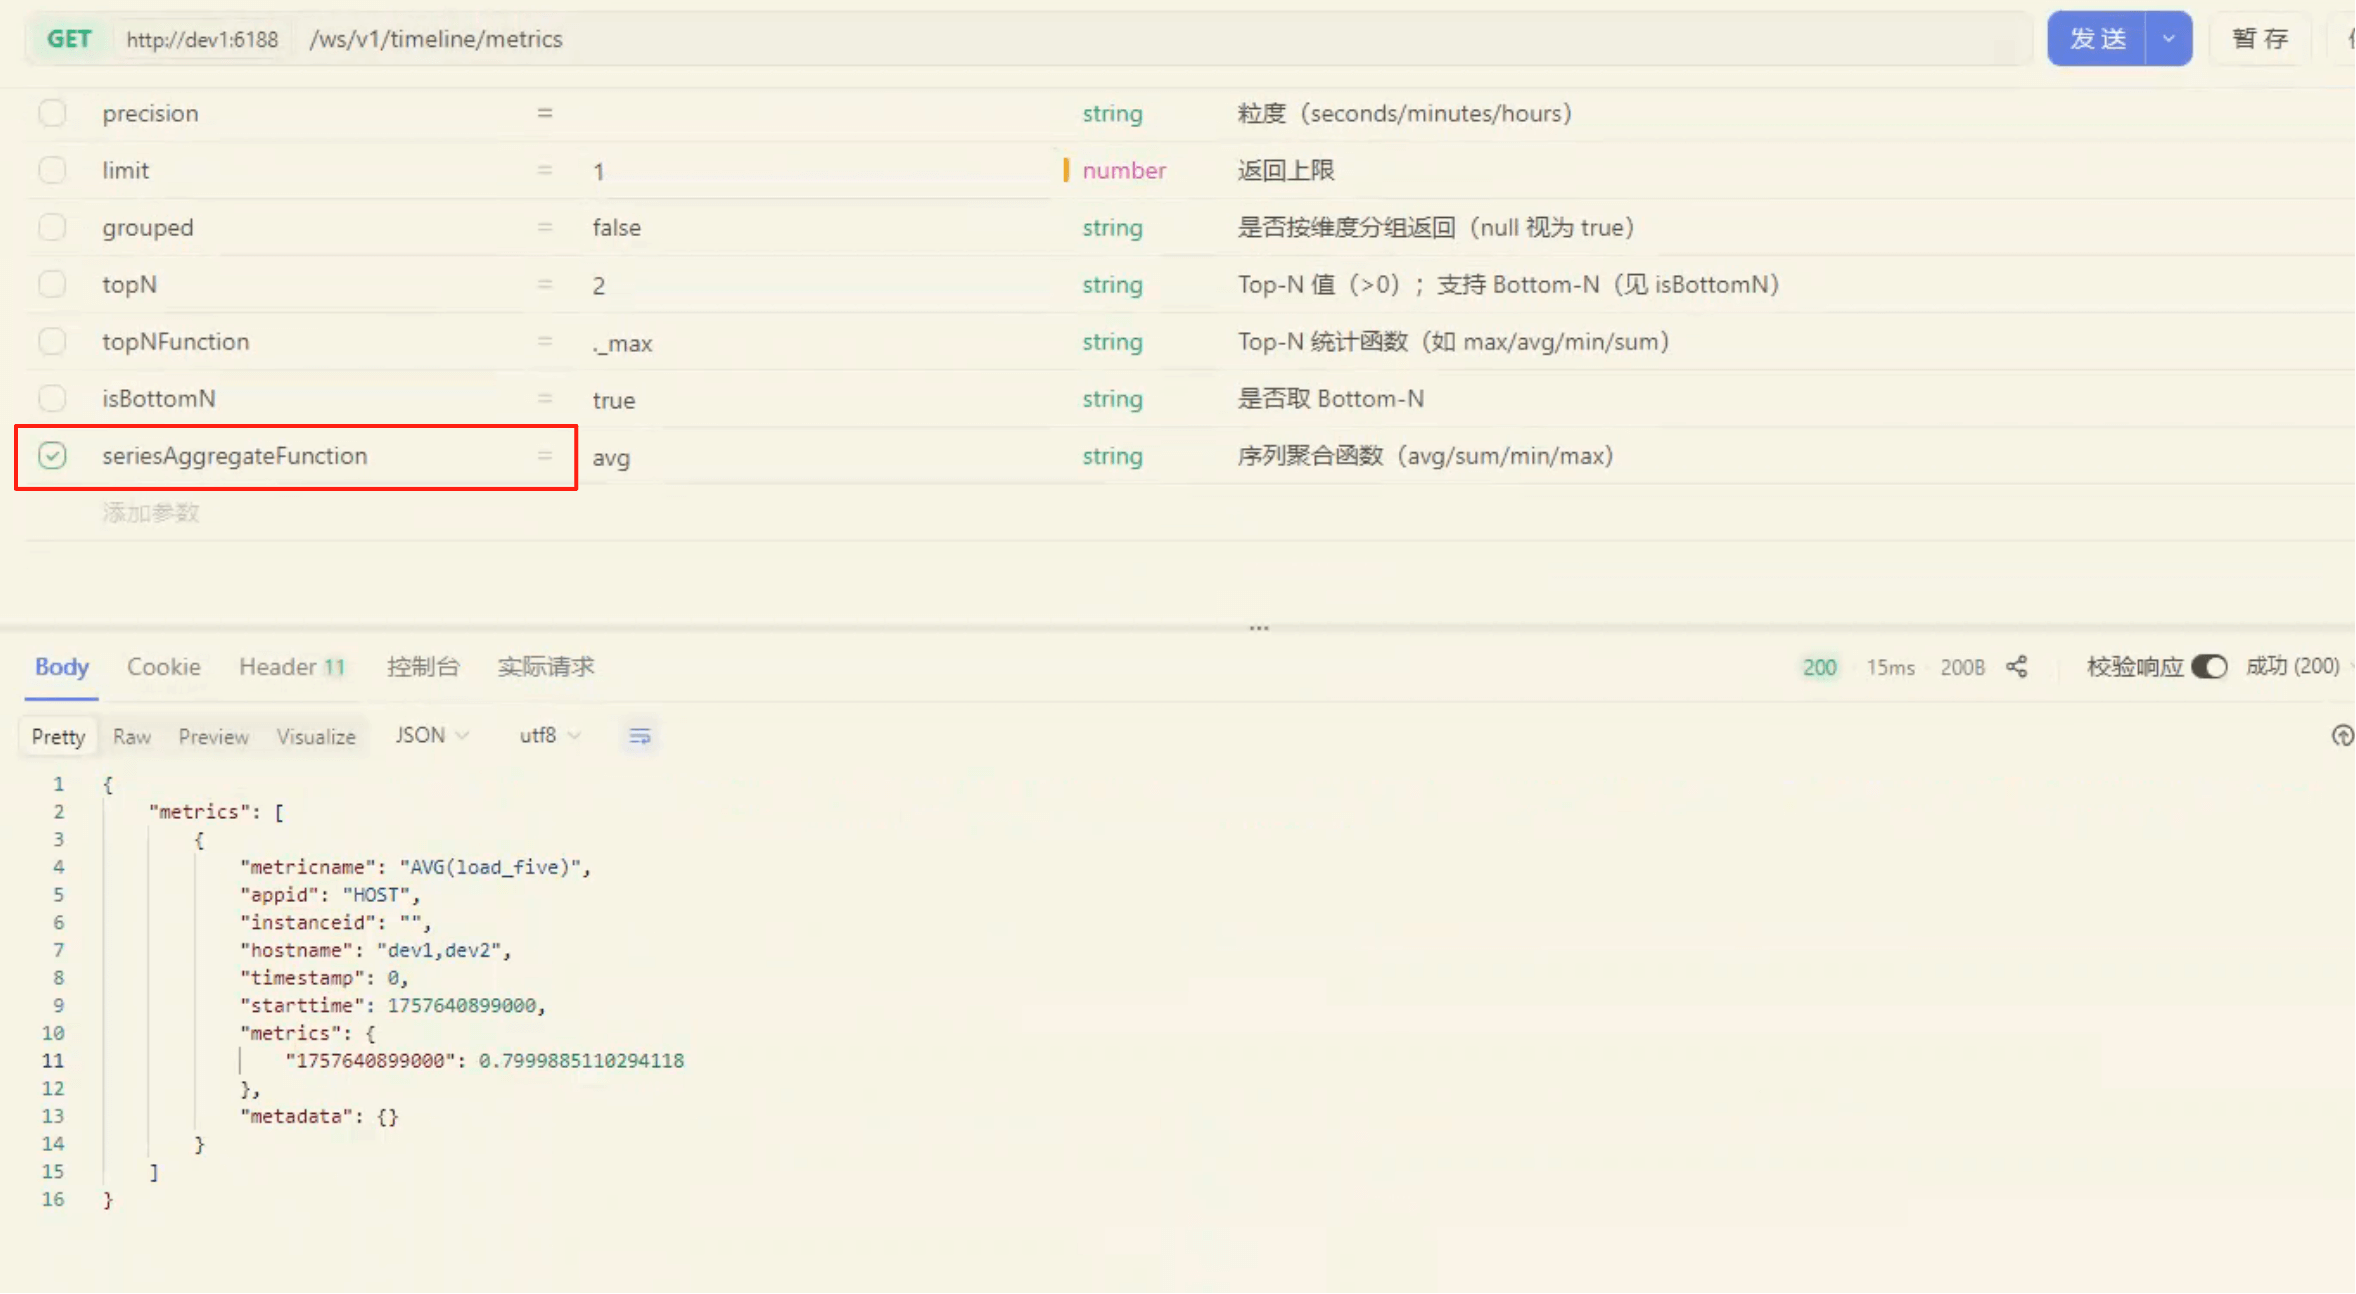
我们在参数中加入 seriesAggregateFunction=avg:
对应的请求:
curl --location --request GET 'http://dev1:6188/ws/v1/timeline/metrics?metricNames=load_five&appId=HOST&hostname=dev1,dev2&startTime=1757640600000&endTime=1757640900000&seriesAggregateFunction=avg' \
--header 'User-Agent: Apifox/1.0.0 (https://apifox.com)' \
--header 'Accept: */*' \
--header 'Host: dev1:6188' \
--header 'Connection: keep-alive'
2
3
4
5
返回结果如下:
{
  "metrics": [
    {
      "metricname": "AVG(load_five)",
      "appid": "HOST",
      "instanceid": "",
      "hostname": "dev1,dev2",
      "timestamp": 0,
      "starttime": 1757640899000,
      "metrics": {
        "1757640899000": 0.7999885110294118
      },
      "metadata": {}
    }
  ]
}
2
3
4
5
6
7
8
9
10
11
12
13
14
15
16
这里可以看到:
- metricName 被自动改为
AVG(load_five) - hostname 合并成
dev1,dev2 - 指标值为 两台主机的平均值
(1.3068 + 0.2931) / 2 ≈ 0.7999
# 3. 对比结论
- 不带聚合函数 → 返回多条指标,每台主机一条
- 带聚合函数 → 返回一条合并结果,按时间戳聚合
笔记
这验证了我们前面“运行示例猜想”的推演:
seriesAggregateFunction 的确会将多个主机的指标值收敛到一条曲线,极大地方便了跨主机监控的对比与分析。